
Have you ever found yourself in the situation of having to organize a complex project, but feeling overwhelmed by the number of tasks and deadlines you have to manage?
You may have heard about tools such as the Gantt chart, the PERT technique and the Kanban method. Kanban method.
But you may not be sure how to apply them to your own project.
In this article, we will explore these tools step-by-step and how they can help you manage your projects more efficiently and effectively.
Let’s start…
What is a Grant diagram?
We surely agree that dependencies in a project are a fundamental aspect, since they refer to tasks that require the completion of several steps, i.e. everything that must be completed from the beginning to the end. To manage these dependencies efficiently, one option is to use the Gantt chart or also called milestone diagram… and now we will see why…
A Gantt chart is a graphical tool used in project management to plan, schedule and visualize tasks over time. It is represented by a horizontal bar chart where each bar represents a specific task or phase of the project. In this illustrated schedule of your project, program or job you will be able to quickly see not only the task and its duration, but also who will execute it and when.
Origin of the routing or Gantt chart
Did you know that two systems merged to give rise to what we now recognize as the Gantt chart in the modern era? I’ll tell you a little more about it below.
The first version of what we now know as the Gantt chart was created by Karol Adamiecki in 1896, who invented what he called the “harmonogram”. Adamiecki shared his findings in Russian and Polish, which limited his access in English-speaking countries. Later, in 1910, Henry Gantt introduced a similar chart in the United States. Its original purpose was to represent the time workers in a factory spent on specific tasks. Over time, both versions were combined into one, achieving a significant impact on project management.
Key Elements of a Gantt Chart
Considering the usefulness of a time diagram, what are the key elements that will help us maximize the planning, follow-up and execution of our project activities? Here are the details:
- Tasks or Activities: the individual actions that must be carried out to complete the project. Each task is represented as a horizontal bar on the Gantt chart, the length of which indicates the estimated duration of the task.
- Time Schedule: The horizontal axis of the Gantt chart represents time, usually in days, weeks or months, depending on the duration of the project.
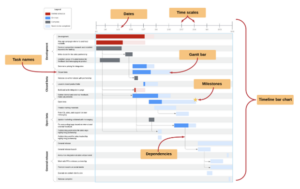
- Task Dependencies: The sequence relationships in which project activities must be completed, represented through lines or arrows connecting the corresponding tasks.
- Task Duration: Time scale represented in the length of the corresponding bar on the horizontal axis of the diagram, with a start and end date for each.
- Milestones: reference points in the project that mark its significant progress.
- Assigned Resources: the resources assigned to each task, such as people, equipment or materials, can be included as additional information.
Gantt chart vs. Timeline: Are they the same?
Although often used interchangeably, a Gantt chart and a schedule are not exactly the same thing. A
On the other hand, a Gantt chart goes beyond a chronogram, as it not only visualizes tasks and their durations over time, but also shows the dependencies between tasks, milestones and assigned resources, all in a graphical view. The timeline is a part of the Gantt chart, but the diagram provides a more detailed and complete view of the project’s progress.
This distinction is important because while a timeline may be sufficient for small projects, a Gantt chart is essential for more complex projects that require extensive planning and tracking.
Gantt chart vs. Kanban: Differences and When to Use Them
Before we start the comparison between the two tools, let’s review what the Kaban method is. The term “Kanban” comes from Japanese and means “card” or “visual signal”, as it originated at Toyota in the 1940s as part of the Lean production system. 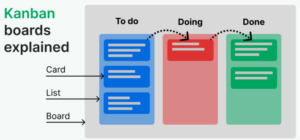
Kanban is a visual management method used to improve efficiency and productivity in project and process management. Tasks are represented as cards or notes and placed on a visual board that shows the different stages of the work process.
Both the Gantt chart and the Kanban method are effective tools in project management, but they have different approaches and applications. Here are the most important differences between the two:
While Kanban focuses on visual workflow, where tasks are represented as cards or notes on a board, the Gantt chart is a visual representation of time, where tasks are shown on a linear calendar. The latter is ideal for projects that require detailed planning and a clear chronological view of tasks with defined deadlines.
On the other hand, Kanban is more suitable for projects with changing requirements and a more agile approach, as it allows flexible management of priorities and rapid adaptation to changes in the project environment.
If you want to go deeper into Kanban I recommend the following article.
The PERT diagram: what is it and when to use it?
The PERT diagram is a tool used in project management to schedule, organize and plan in detail the tasks of a project and the dependency relationships between them.
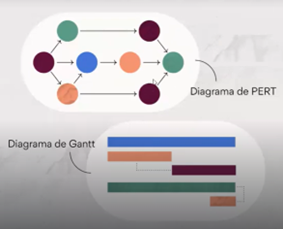
The acronym PERT stands for Program Evaluation and Review Technique. It provides a visual representation of a project schedule and breaks down the individual tasks. This diagram is similar to the Gantt chart, but its structure is different; the Pert chart type does not require defining start and end dates of tasks, although dependencies between tasks must be established.
PERT is especially useful in situations where there is a large amount of uncertainty in time estimates and a more detailed approach to project planning and scheduling is required. It is commonly used in research and development projects, construction projects, engineering projects and other complex projects where time estimates can be difficult to determine accurately.
Conclusions
In conclusion, the choice between the Gantt chart, the Kanban method and the PERT chart depends largely on the specific needs and characteristics of each project. Let’s review the advantages of each.
To be honest, the Gantt chart is useful in a wide variety of projects, although you will be able to take best advantage of its functionalities in those projects that require detailed planning, efficient time management and the coordination of multiple activities and teams.
On the other hand, if you are looking for flexibility, adaptability and efficient workflow management, the best option among these three alternatives will be the Kanban method. This is because of its ability to visualize work in progress, identify bottlenecks and make quick adjustments.
Finally, the PERT chart is especially valuable on complex projects where time estimates can be difficult to determine accurately.
The project management journey never ends, so be sure to keep up to date on new ways to work more effectively.