Has it ever happened to you that you are in a company and you don’t know with whom you have to deal with certain issues when a need arises?
Are you clear about your role but unclear about the role of others, and no one seems to take responsibility for certain actions?
Do you know how the way your company is organized is affecting the way you communicate, and how it is impacting your product or service?
What is an Organizational Chart? What is its importance in the organization?
The organizational chart is a fundamental tool that provides a visual representation of a company’s organizational structure. Through a graphic design, the organization chart shows the hierarchy of authority, the different departments, teams and the interaction between them. This tool is essential to understand the internal structure of a company, the responsibilities of each position and how communication and decision making flow in the organization.
It will be a tool that will allow, among other things:
- Uncovering power and authority relationships: Essential to understanding decision making and communication flow.
- Define roles and responsibilities: Allows to identify duplications, bottlenecks and areas of opportunity to improve the communication process.
- Visualize the organizational structure: It facilitates the understanding of the company as a whole, both for employees and stakeholders.
As mentioned above, this diagram allows you to understand the communication flows. And why is it important to understand them? Conway’s Law states that “Any organization that designs a system will produce a design that copies the communication structure of that organization”, or in other words, one of the key aspects to guide your business is to create a communication structure according to it.
It is often thought that an organizational chart is more related to more traditional companies, while in more modern flexible companies, it is not so important and counterproductive. And yet, the failure to provide the company with an organizational framework is the reason why many companies end up with a disconnect between the different business areas. Providing the company with an organizational chart provides the key information for this coordination, in addition to better sizing the organization and preparing it for natural growth.
Types of Organization Charts: Exploring the Different Structures
Organizational charts are essential tools for understanding and visualizing the structure of an organization. Each type of diagram has unique characteristics that make it suitable for different scenarios and needs. Depending on the needs, culture and strategy of the company, you may identify with one of these 5 models below, although there are countless options.
Vertical Organization Chart: The Traditional Hierarchy of Power
The vertical organization chart, also known as the hierarchical model, is the most traditional configuration, which follows a pyramidal structure with clear and defined lines of authority. In this type of diagram, authority and responsibility flow from the top down, and employees report to a single direct supervisor.

- A clear hierarchy of authority and responsibility is established.
- Decisions are made centrally from the top of the hierarchy and communicated downward.
- The roles and responsibilities of each employee are clearly defined.
Business model: Companies with well-defined hierarchical structures, such as government institutions or armed forces.
Horizontal Organization Chart: Fostering Communication and Collaboration
In contrast to the vertical configuration, the horizontal or non-hierarchical organization chart promotes collaboration, communication and the active participation of employees in decision making. In this type of diagram, hierarchical layers are eliminated and autonomy and shared responsibility between teams and departments is encouraged.

- Promotes collaboration and direct communication among employees, which facilitates decision making and project implementation.
- Encourages autonomy and shared responsibility across teams and departments, which will increase employee motivation and commitment.
- Promotes adaptability and rapid response to changes and challenges, facilitating innovation and continuous improvement.
Business model: Companies that seek to foster innovation and agility, such as startups or companies in the technology sector.
Functional Organization Chart: Departmental Specialization
The functional organization chart focuses on specialization by specific functions, grouping employees according to their skills and technical competencies. In this type of organization chart, each department is in charge of a specific activity, maximizing the specialization of its members.

- It facilitates specialization and focus on specific areas, which can increase efficiency and quality in the performance of tasks and projects related to that area of knowledge.
- Quite useful for organizations with complex and specialized tasks, which helps to reduce the cognitive load of work teams.
- It facilitates the identification of experts in each area.
Business model: Companies with specialized departments, such as hospitals, universities or consulting firms.
Matrix Organization Chart: Flexibility and Dynamic Response
The matrix organization chart combines aspects of both vertical and functional compositions, offering a dual structure with both cross-functional and functional lines of authority. It is a model designed to fill the gap in functional organization charts and to promote cross-cutting initiatives. In this type of diagrams, teams are configured to cover all the needs of a project, which will impact on different areas of expertise, so each of the members will also depend on the functional area corresponding to their expertise.

- It offers greater flexibility to respond to strategic challenges, facilitating the implementation of cross-cutting projects without losing sight of the specialization of certain tasks.
- Promotes collaboration and communication between the different departments, facilitating the integration of the different modules of the system.
- It makes use of the advantage of knowledge specialization without losing sight of the global vision.
Business model: Companies that manage complex projects involving different departments, such as aerospace or pharmaceutical companies.
Mixed Organizational Charting: Combining Elements for Organizational Effectiveness
This model combines different elements of all of the above, adapting to the specific needs of the company. This type of compositions is especially useful when it comes to companies working in different areas of innovation, where depending on which areas you need more flexibility or more stability. To understand this, I recommend delving into Wardley’s maps, to represent the environments in which a company operates.
- It combines elements of the above configurations to suit the specific needs of the company.
- It facilitates the implementation of strategies by adapting the model according to the specific strategic line.
- It offers very high flexibility, as companies using this model are likely to adapt it according to the challenges of the context.
Designing an Effective Organization Chart
A well-designed organization chart is a fundamental tool for visualizing the structure, roles and power relationships within an organization. Not only does it serve as a graphical representation, but it can also be a valuable guide for internal communication, decision making and strategic planning.
How to Make an Organizational Chart: Key Steps for Construction
The first step in creating your organizational chart is, without a doubt, to know your starting point. To do so, you must know how to draw the current composition of the company. And beware, many companies already get stuck at this point. To move your organization towards a structure aligned with your business model, you need to know the current state and how it affects the business.
What is the ideal organizational chart for my business model? There is no recipe, but you can follow these simple steps:
- Visualize and analyze your business strategy: This can be done with the aforementioned Wardley Maps. This visualization allows for discussions on the current situation of the business and where the natural evolution of each of its aspects should be.
- Segment the business into components: Without losing sight of the overall strategy, this step will help you choose which hierarchical structure best accommodates each of the functional components. For example, within a company, a component that covers basic services (whose focus is on its evolution) does not have to be organized in the same way as those components that are trying to carve out a niche in the market (where the focus is on innovation).
- Define the necessary functions: Starting with the functions to shape your organization chart is much more powerful and easier than starting with the hierarchical structure, since the latter must be designed to support the functions that will articulate the business strategy.
- Define the work hierarchy: Within any organization there are hierarchical structures, whether they are more horizontal or vertical, based on individuals or decision groups. Choose the right hierarchy to support the functional groups.
- Be prepared to change: A good organization chart is one that is prepared to adapt quickly, according to strategic needs. We have often seen compositions that articulate changes in no less than a year, and end up losing competitiveness and market position.
Tools and Software to Create Business Organization Charts
Although my recommendation is that any visualization tool is good, as long as it is easy and accessible, the ones I show below work very well for me:
Online tools:
Lucidchart
Lucidchart: Offers customizable templates, real-time collaboration and advanced features for complex diagrams.
Canva
Easy-to-use tool with a wide variety of templates and graphic elements to create attractive diagrams.
Miro
Virtual whiteboard ideal for team collaboration and the creation of dynamic and interactive diagrams.
chart
Charting software specialized in the creation of diagrams with advanced functions for the management of complex organizational structures.
Creately
Online tool with a wide range of templates and functions for creating organizational, flow and other types of diagrams.
The Agile Organization Chart: Adaptability in Project Management
The distribution of roles and relationships in Agile is nothing more than the representation of an organization so that your company’s strategy is as dynamic and adaptable as possible to the constant changes in the market. To achieve this, one of the main keys to success is to design each of the components aligned with the value chains provided by your organization, thus creating Value Centers. Different keys to move towards an Agile paradigm helped by your hierarchical structure:
- Identify areas for improvement in communication and collaboration: A rigid diagram can hinder the flow of information and collaboration between teams.
- Promote more horizontal and flexible structures: Agility requires structures that adapt quickly to change and encourage team autonomy.
- Implement agile practices at different levels of the organization: The diagram provides insight into where agile methodologies best fit and how to integrate them into the existing structure.
In an Agile organization chart, it is very important to have different business areas, but above all, the People area of the organization. Discover how HR can help your organization: Agile HR: HR as a key piece in the Agile transformation – Smartway.
Corporate Organization Chart: Examples and Real Cases
Manu Cornet, cartoonist, drew in 2011 the organizational chart of 6 big companies at that time, such as Apple, Oracle, Amazon, Facebook, Google, and Microsoft. The greatest impact of those drawings turned out to be that they perfectly reflected the design of each organization’s products, as well as its corporate culture.
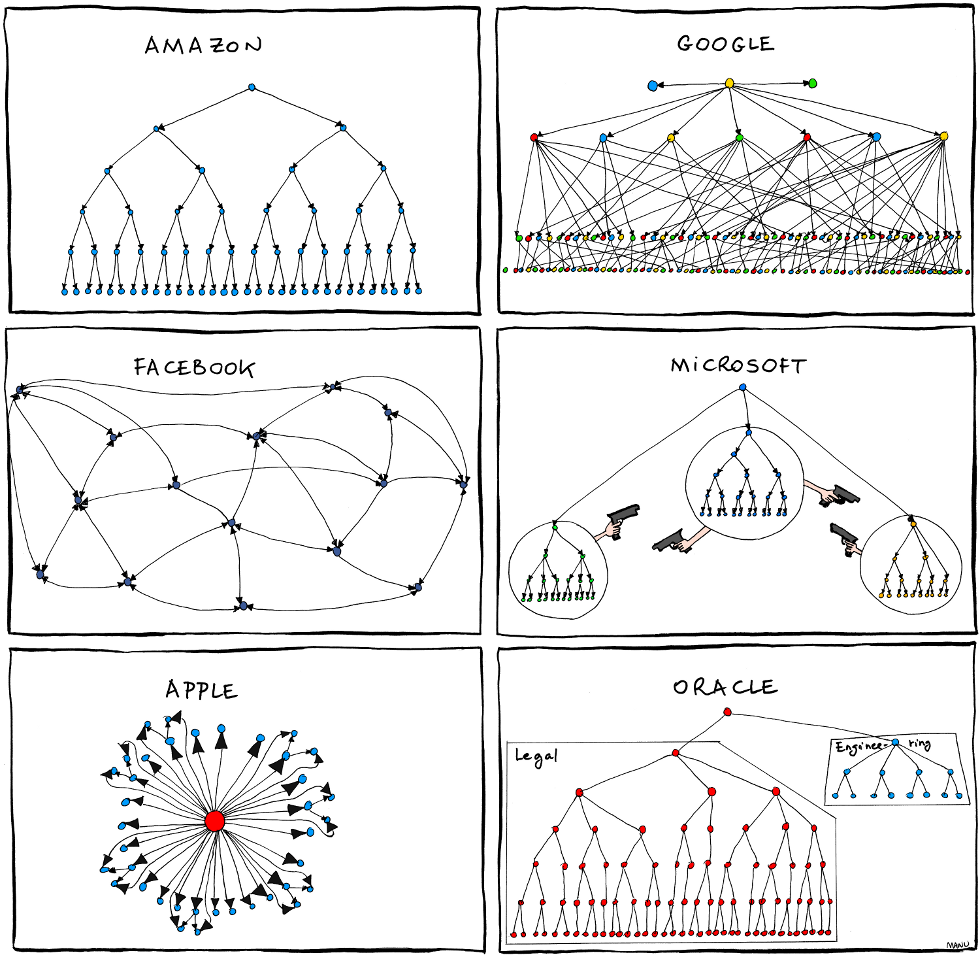
- Amazon: Relationships at Amazon show how, at least in 2011, Amazon was vertically structured, as has become common in multiple companies. All members report to a department leader, who are the ones who interact with the CEO.
- Apple: By 2011, Apple was led by Steve Jobs. Here it is shown how everything circulated around his figure. Any launch or idea had to go through his supervision, in addition to each and every step of the product design. This structure was left behind when Tim Cook took the helm, molding the teams to give it a more collaborative and less single-person-centric approach.
- Microsoft: Microsoft’s hierarchical design highlights the enormous internal competitiveness, and how this reduces collaboration. The level of competitiveness is such that the different departments compete with each other to gain the upper hand.
- Oracle: This design highlights that, out of the ordinary, the legal structure is much larger than the technology structure. By the time the drawing was made, Oracle was dedicated to growing by acquiring companies, so its major product development is on the legal side.